Nationwide Routing & Cost Analysis
Solely authored
Business analysis & recommendation · Automatic Pool Covers
Full deliverable kept confidential (internal company work).
- Context
- Created during my logistics internship to evaluate routing-software options across 35+ service markets and quantify potential savings.
- Claim
- Shows I can run an analysis on my own, let the data drive the decision, and turn the result into a recommendation people will act on.
- Reasoning
- It's the clearest proof of my "evidence-first" brand. I owned the problem from start to finish and presented my conclusions to senior management, the same kind of work legal analysis asks for.
Salary Regression Analysis
Solely authored
BNAN Discussion 6 · Multiple-regression report
Read the report ↗
- Context
- A business-analytics report studying starting versus mid-career median salaries across 138 school districts, written for a career-services audience.
- Claim
- Shows I can build and compare regression models (quadratic, lin-log, log-lin, and log-log), choose the best fit by adjusted R², and read real meaning out of the numbers.
- Reasoning
- The log-log model won at an adjusted R² of 0.77, and I explained what that means in plain terms. Statistical reasoning plus clear writing is the rigor a law school looks for.
- Context
- My Digication ePortfolio, where a wide range of my skills is highlighted at the top of the page and developed below.
- Claim
- Shows the breadth of what I can do and, just as important, how I reflect on each skill. A reader can work through it and draw their own conclusions.
- Reasoning
- The "evidence plus reflection" format is exactly how I want an admissions reader to weigh me, the same logic this whole site runs on.
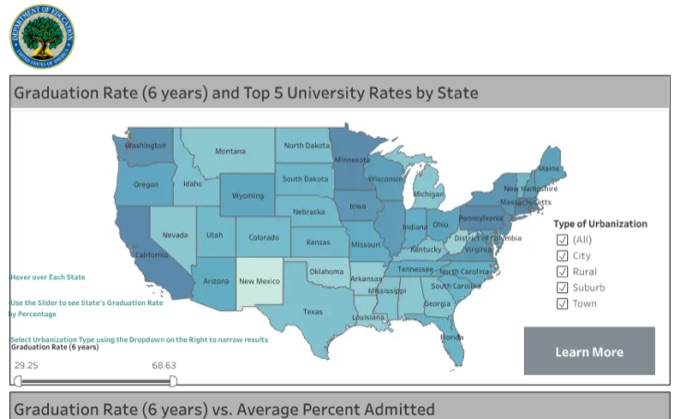
- Context
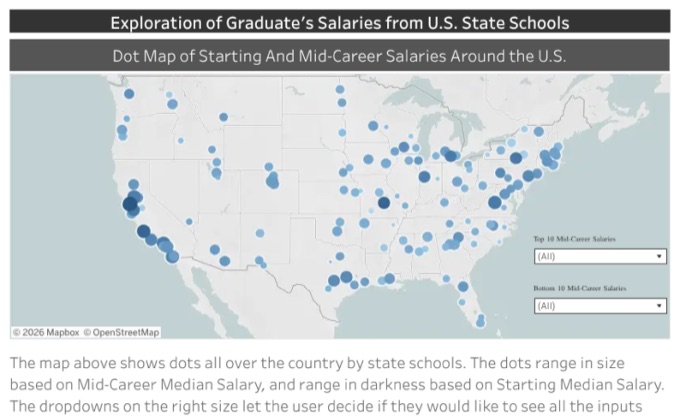
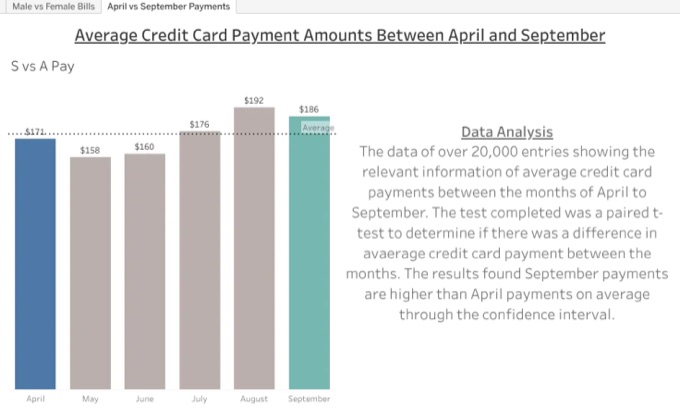
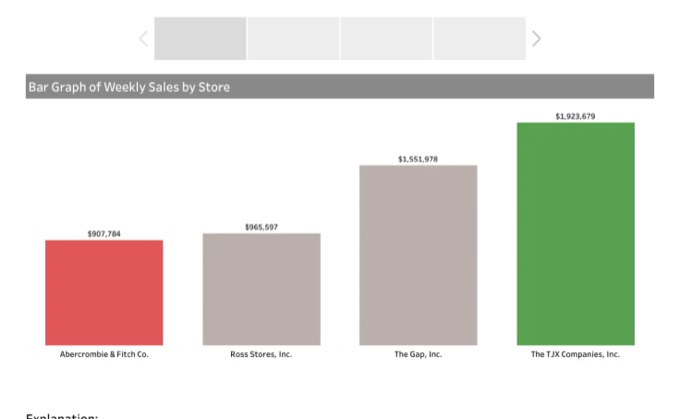
- A set of Tableau dashboards and stories I built across my business-analytics courses, each one turning a raw dataset into something a reader can follow.
- Claim
- Shows I can work with quantitative data and design visuals that hold up to questions, from salary regressions to payment trends to retail sales.
- Reasoning
- It backs up the analytical side the rest of the portfolio rests on, this time in a visual form anyone can read at a glance.